Feature Friday Episode 9: Cash Flow Forecasting with RUX Financial Dashboard


Understanding future cash positions should not require guesswork
Cash flow management plays a critical role in every business. Organizations need visibility into current cash balances, expected inflows, upcoming expenses, and future cash needs to make informed financial decisions.
Unfortunately, forecasting cash flow often requires manually combining information from multiple reports, spreadsheets, and systems. By the time the data has been gathered and analyzed, the insights may already be outdated.
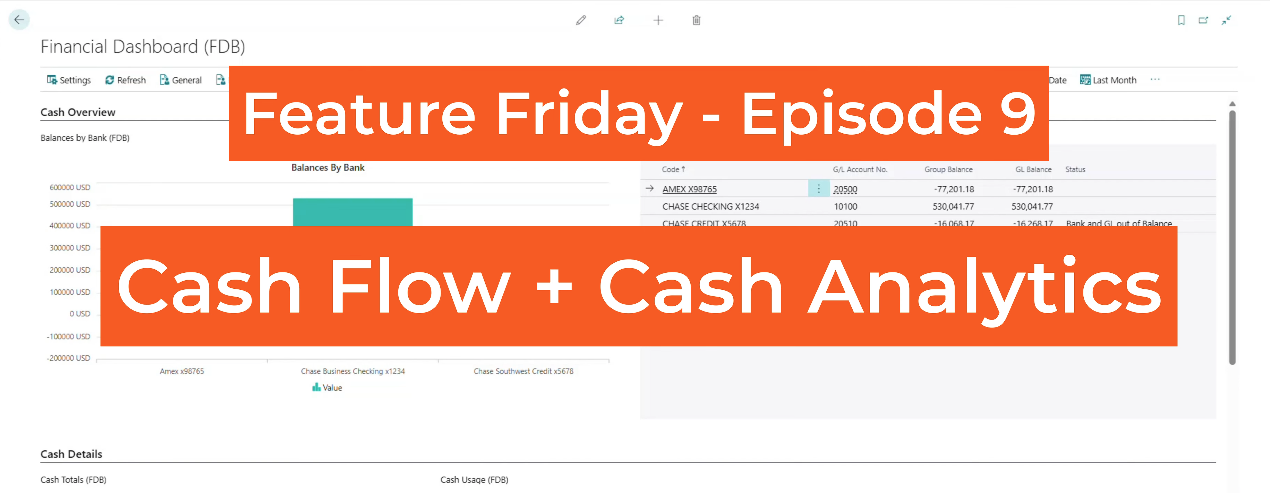
Feature Friday Episode 9 demonstrates how RUX Financial Dashboard helps organizations monitor cash positions, validate financial health, and forecast future cash flow directly within Microsoft Dynamics 365 Business Central.
The challenges of cash flow forecasting
Maintaining visibility into cash positions requires more than simply reviewing bank account balances.
Finance teams often need to understand how accounts receivable, accounts payable, sales activity, purchasing activity, and expected customer payments will impact future cash flow. Gathering this information manually can be time-consuming and often leads to fragmented reporting.
Without a centralized view of financial activity, organizations may struggle to identify trends, plan for upcoming obligations, and confidently manage cash positions.
Key benefits
- Improve cash flow visibility
- Centralize financial insights
- Reduce manual forecasting efforts
- Monitor financial health indicators
- Support better financial planning
Monitor current cash positions in one place
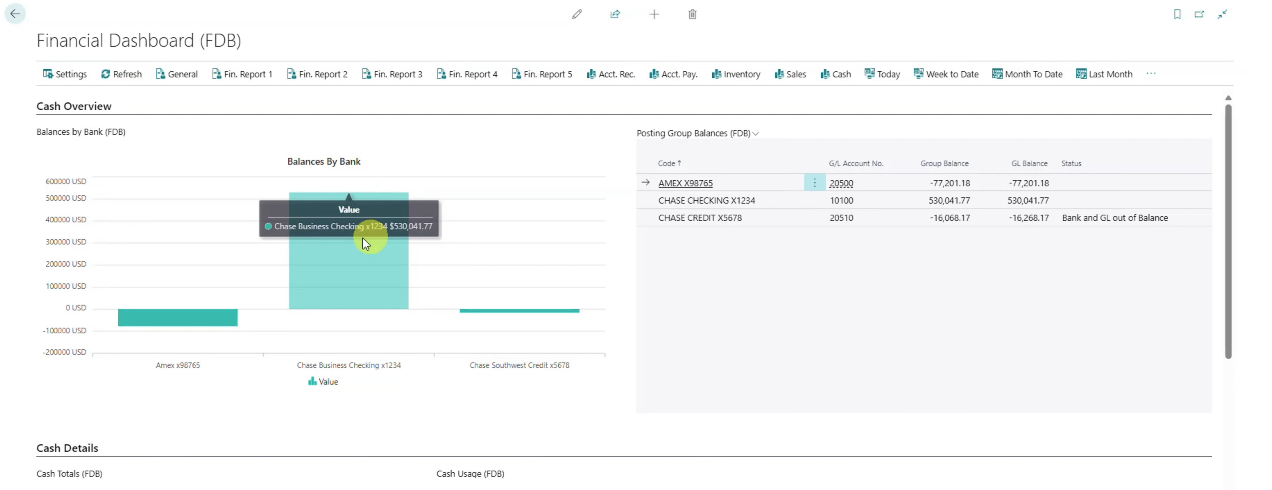
RUX Financial Dashboard provides immediate visibility into cash balances across bank accounts within Business Central.
As demonstrated in this episode, users can quickly review current cash positions across their entire environment through interactive visualizations that consolidate critical information into a single workspace.
This allows finance teams to understand available cash at a glance without navigating between multiple pages or reports.
Key benefits
- View current cash balances quickly
- Consolidate cash information
- Improve financial visibility
- Reduce reporting complexity
- Support faster decision-making
Validate financial health with built-in balance checks
Accurate forecasting begins with accurate data.
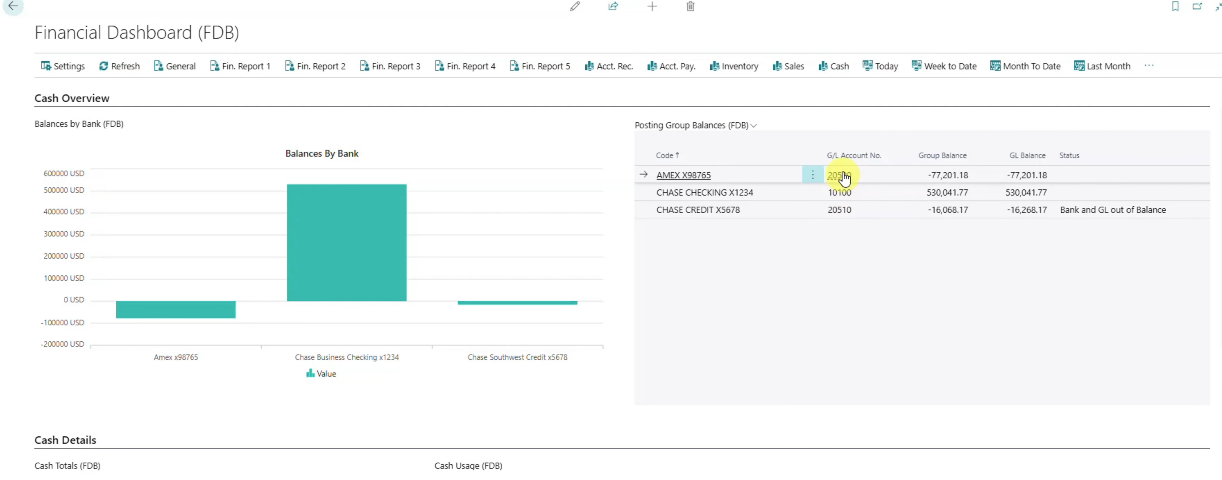
RUX Financial Dashboard includes validation tools that help organizations identify inconsistencies between bank accounts and general ledger accounts. The dashboard can also help verify that subledgers remain aligned with their general ledger counterparts.
These checks provide additional confidence in the financial information being used for forecasting and analysis.
By identifying potential discrepancies early, finance teams can address issues before they impact reporting or forecasting activities.
Key benefits
- Verify account balances
- Identify potential discrepancies
- Improve reporting accuracy
- Monitor financial controls
- Increase confidence in financial data
Analyze cash composition and historical trends
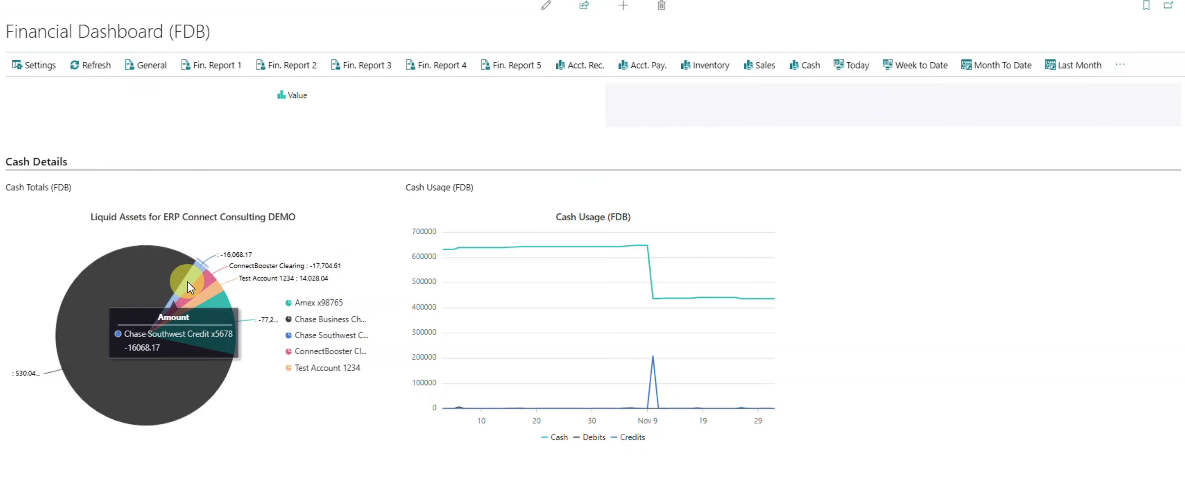
In addition to current balances, organizations often need visibility into how cash is distributed and how it changes over time.
As highlighted in this episode, the dashboard includes a cash position visualization that shows the percentage contribution of each cash source. It also provides historical cash usage trends, helping teams understand how cash balances have changed over previous periods.
This historical visibility helps finance teams identify patterns and better understand how operational activities affect liquidity.
Forecast future cash flow with predictive analytics
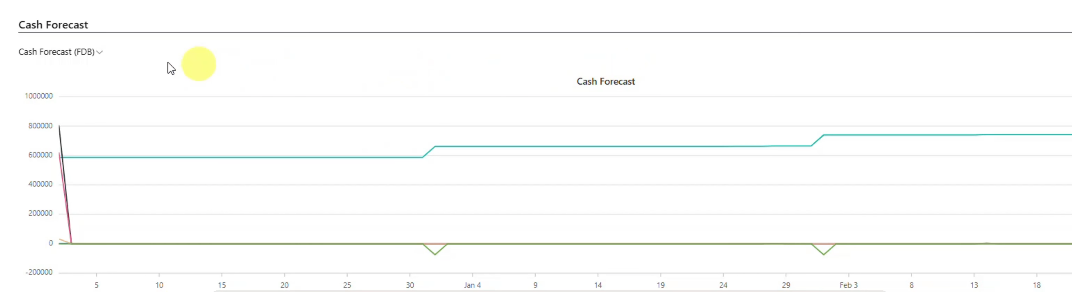
One of the most valuable capabilities within RUX Financial Dashboard is the Cash Flow Forecasting functionality.
Unlike traditional forecasting methods that rely solely on static assumptions, the forecast incorporates current cash balances, open accounts receivable, open accounts payable, released sales orders, and released purchase orders.
The solution also uses predictive analytics to estimate customer payment behavior. Rather than relying exclusively on payment terms, the forecast analyzes recent customer payment patterns to estimate when cash is likely to be received.
This creates a more realistic projection of future cash positions and helps organizations make more informed planning decisions.
Key benefits
- Forecast future cash positions
- Include AR and AP activity
- Incorporate sales and purchasing data
- Improve forecasting accuracy
- Leverage customer payment behavior
Export detailed forecasts to Excel
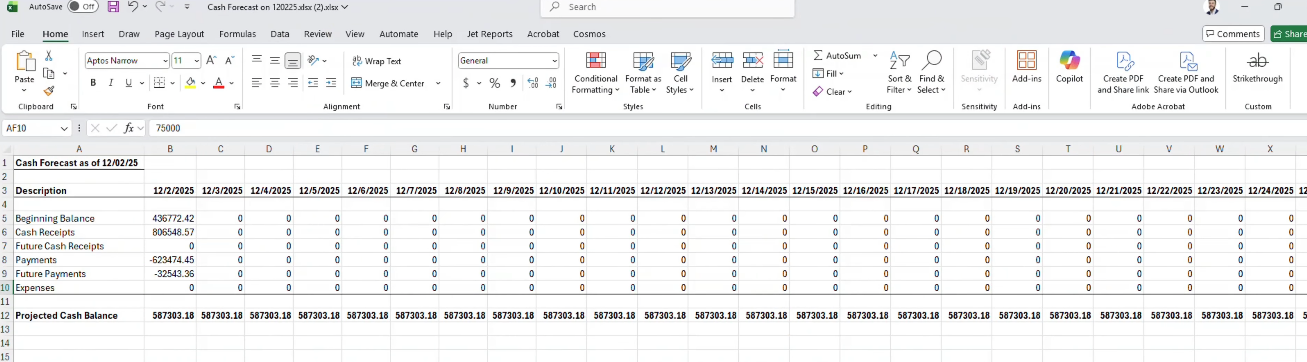
Sometimes organizations need a more detailed view of future cash activity.
RUX Financial Dashboard allows users to export forecasting information to Excel, providing visibility into expected daily inflows and outflows. This detailed information helps teams perform additional analysis while maintaining visibility into how projected cash balances change over time.
The ability to move from high-level dashboard insights to detailed forecasting data gives organizations greater flexibility when evaluating financial decisions.
Key benefits
- Export forecast data to Excel
- Review daily cash movements
- Support detailed financial analysis
- Improve planning visibility
- Simplify reporting processes
Greater visibility for growing organizations
As businesses grow, managing cash flow becomes increasingly important. Finance teams need visibility into current cash positions while also understanding how future transactions will impact liquidity.
RUX Financial Dashboard helps organizations improve financial visibility by bringing cash balances, health checks, historical trends, and forecasted cash activity into a single workspace within Microsoft Dynamics 365 Business Central.
By combining real-time financial data with predictive forecasting, organizations can improve planning, strengthen cash management processes, and make more informed business decisions.
Watch Feature Friday Episode 9
Watch the full Feature Friday episode to see how RUX Financial Dashboard helps organizations monitor cash positions, validate financial health, analyze historical trends, and forecast future cash flow within Business Central.
Ready to improve cash flow visibility in Microsoft Dynamics 365 Business Central? Download a FREE 30-day trial of RUX Financial Dashboard from Microsoft AppSource today and discover a more effective way to track and forecast cash positions.



Ready to take control of your operations?
RUX engineered oil and gas field service software to fit your operation—no patches, no guesswork. Business Applications built and configured for the oilfield service industry, our software solutions give you clarity and control to move forward with confidence.