RUX Sales Dashboard


Sales Dashboard
The goal of using our Sales Dashboard is to give Salespeople, Sales Managers, and C Level executives greater insights into their Business Central data. These dashboards provide key data for all the ways you can slice and dice your data. Whether it be views by State or Country on a bubble map, sales by customer, sales by salesperson, or sales by dimension, our Sales Dashboard will give easy to view visibility into these metrics.
All of the metrics, reports, and KPIs on the dashboard are directly embedded inside of Business Central. No external connections and data calls ensure accuracy and security and also help with the overall reporting speed. By optimizing these factors, you will have the peace of mind that data is restricted to only those who should see the data (including drill downs).
Since it is embedded in Business Central, that also means managing the dashboard will look and feel like everything else already in Business Central. As long as users have a Business Central license and have permissions to view the dashboard, they will be able to get up and running in as little as 15 minutes. One flat yearly fee also ensures that you will not feel restricted by additional hidden costs due to added headcount on your end.
Charts and Metrics Include:
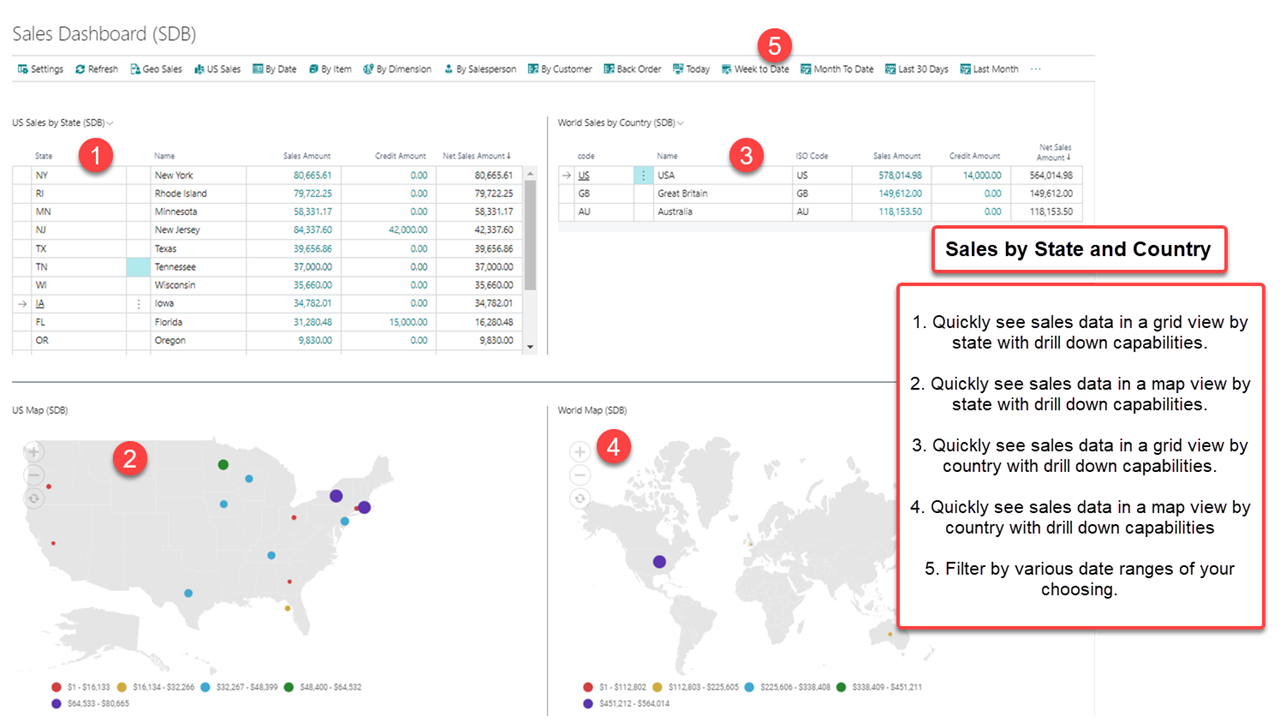
World Sales
- Sales by Country Data Grid
- Sales by Country Bubble Map
US Sales
- Sales by State Data Grid
- Sales by State Bubble Map
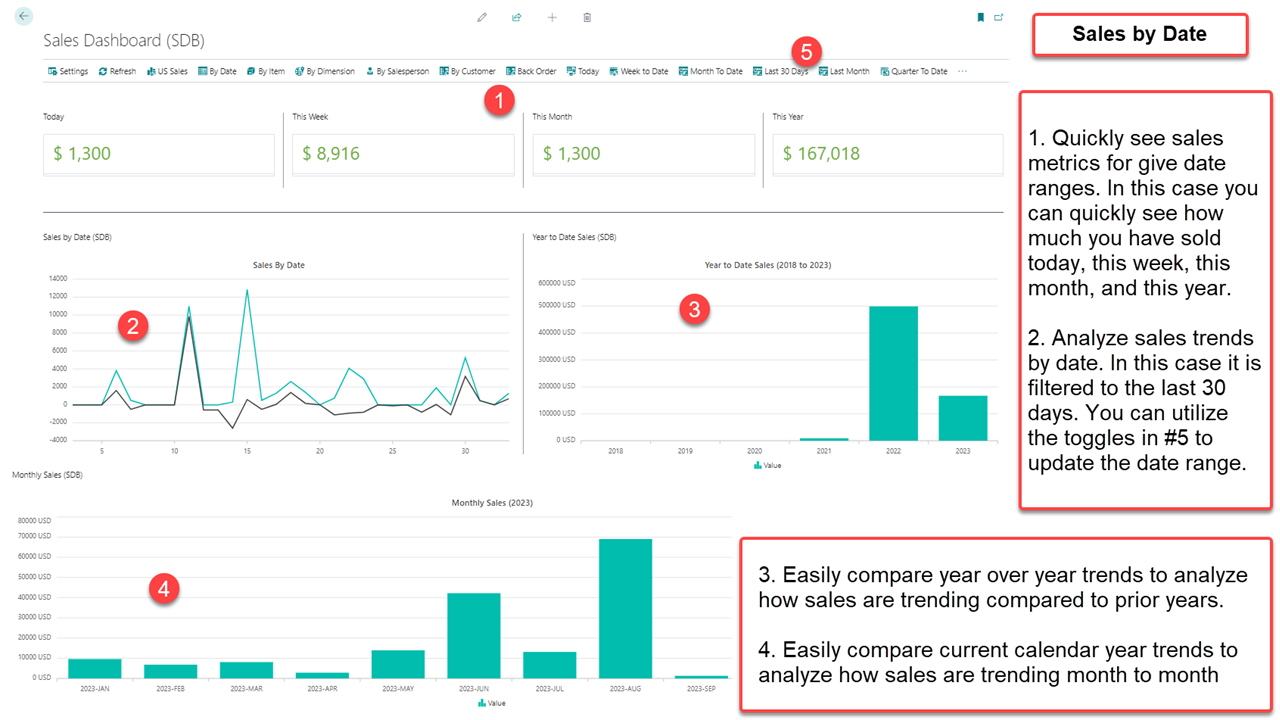
By Date
- Today's Sales
- This Week's Sales
- This Month's Sales
- This Year's Sales
- Sales by Date Line Trend
- Year to Date Sales Bar Chart
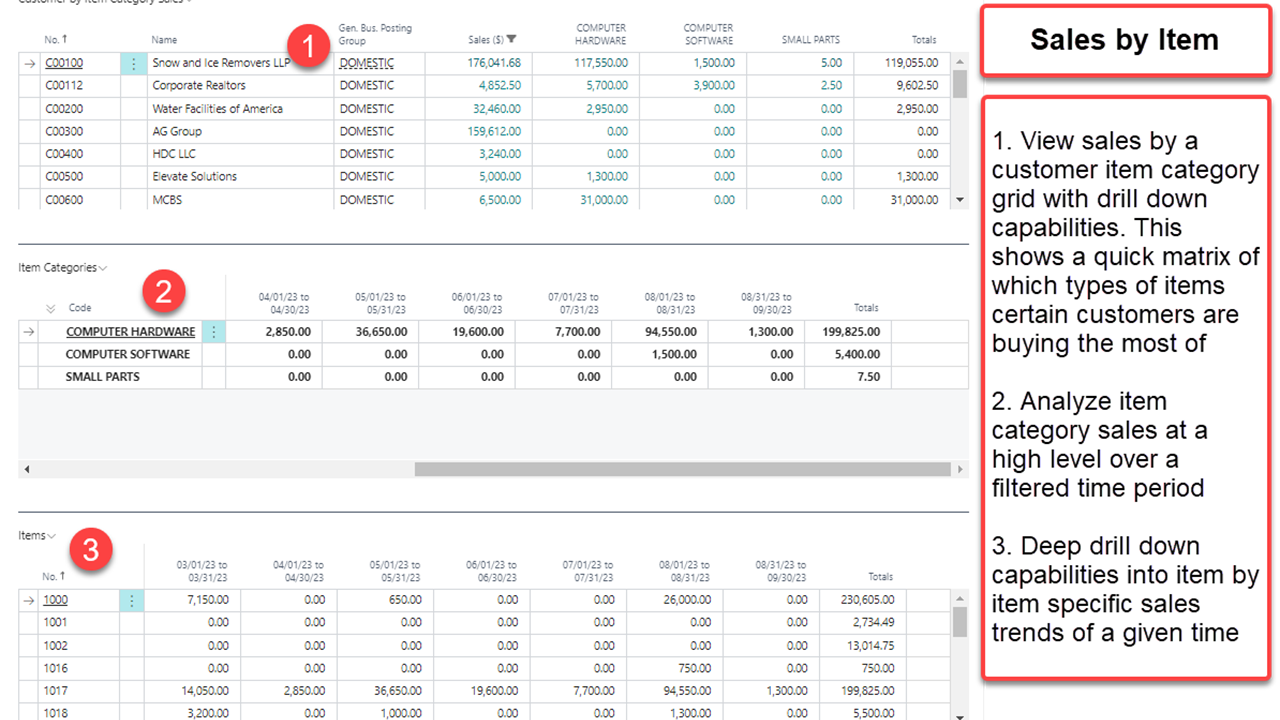
By Item
- Customer by Item Category Sales
- Item Category by Customer by Date
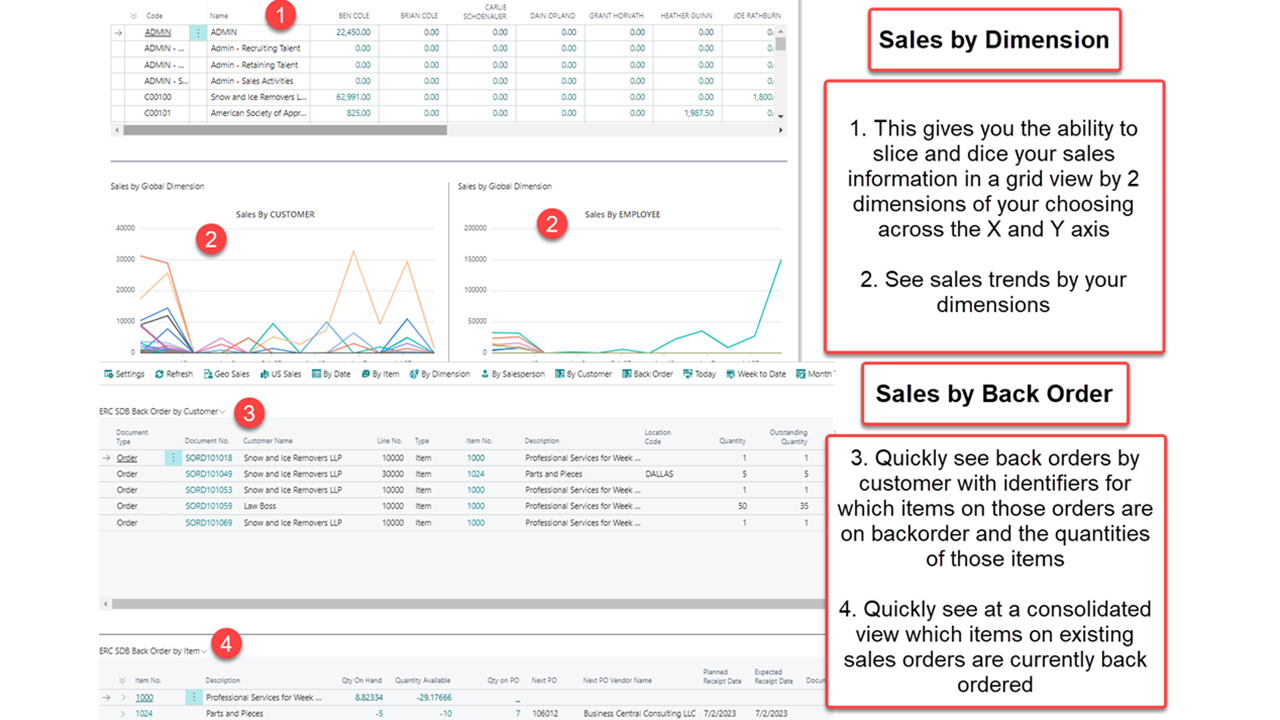
By Dimension
- User Defined Dimension by Dimension Sales Grid
- Sales by Global Dimension #1
- Sales by Global Dimension #2
- Sales by Dimension by Date
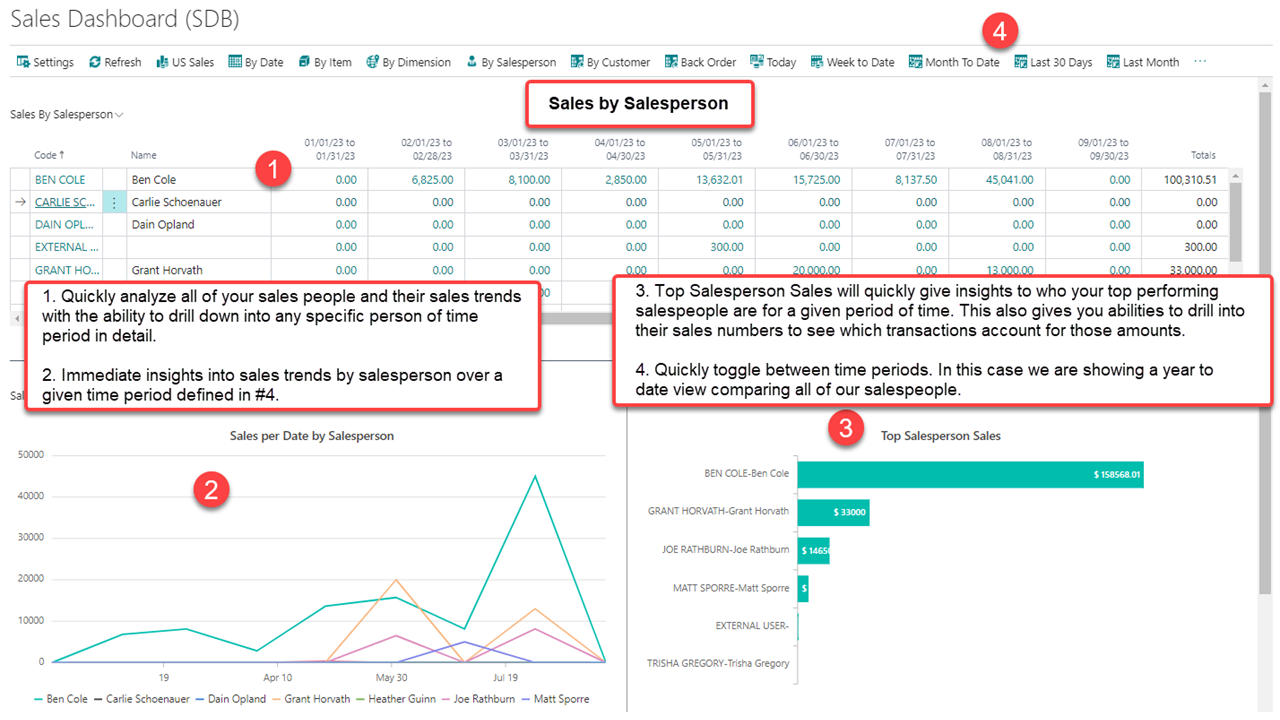
By Salesperson
- Sales by Salesperson
- Sales by Salesperson by Date
- Top Salesperson Sales
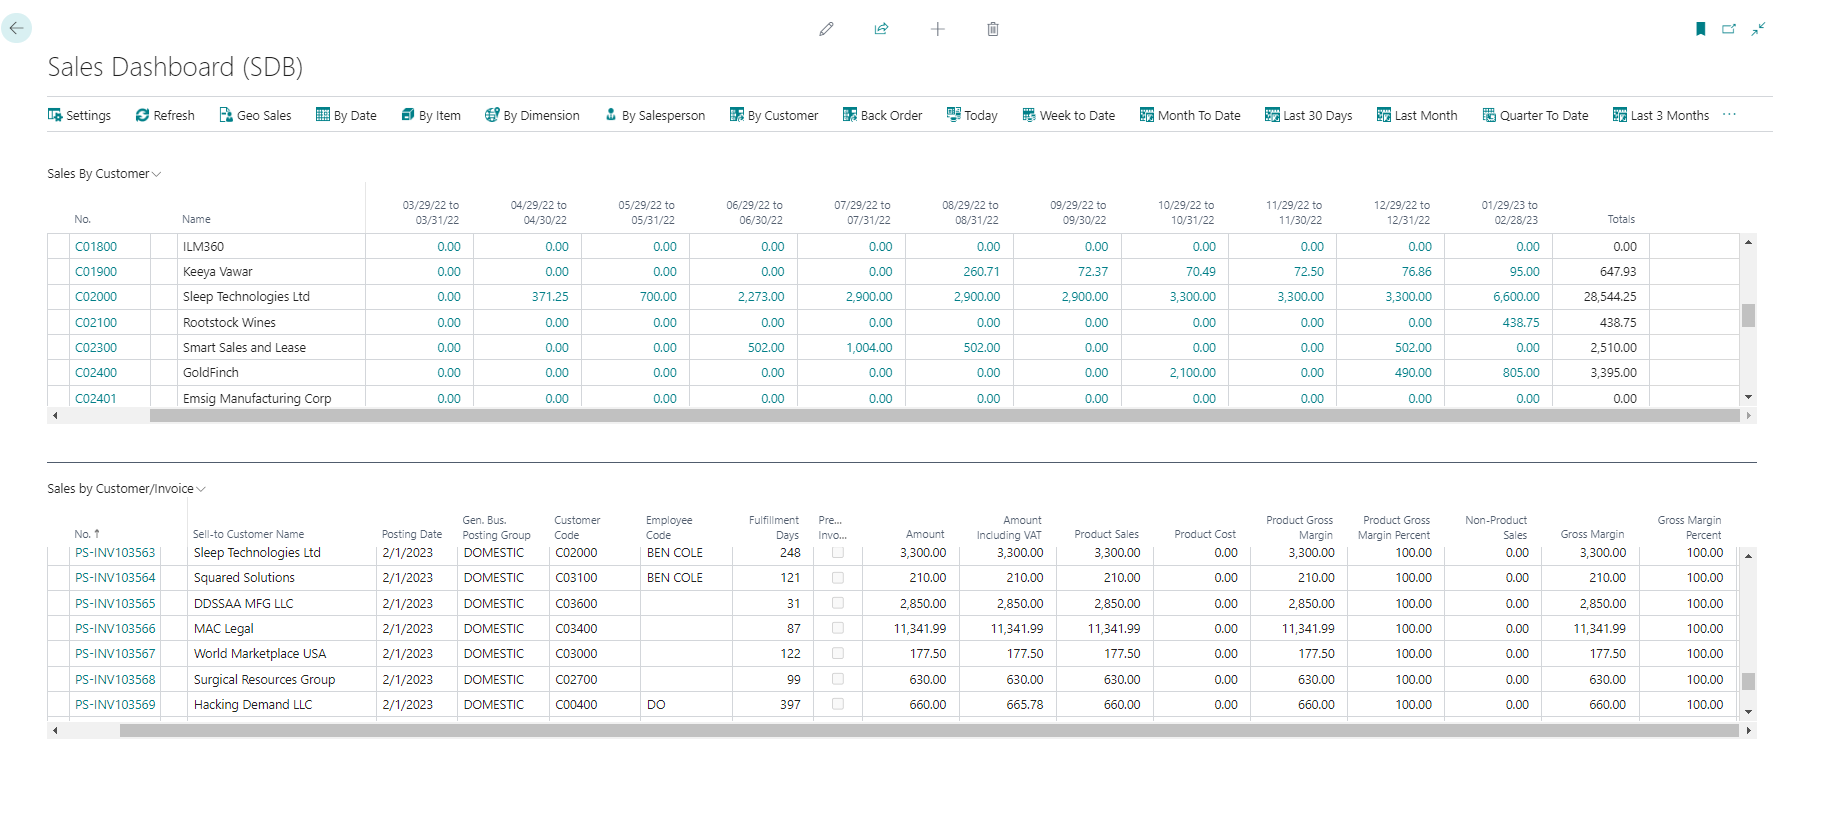
By Customer
- Sales by Customer
- Sales by Customer/Invoice
Additional Functionality
- Sales Analytics Page to see all posted sales documents across multiple BC companies in one place
The AppSource download includes a 30-day evaluation license automatically installed at no charge.
Sales Dashboard - Setup and Overview
Toolbox Tuesday - Episode 15: Dashboard Bundle
Toolbox Tuesday - Episode 34: Dashboarding and Reporting
Dashboard Configuration for D365 Business Central
World Sales
- Sales by Country Data Grid
- Sales by Country Bubble Map
US Sales
- Sales by State Data Grid
- Sales by State Bubble Map
By Date
- Today’s Sales
- This Week’s Sales
- This Month’s Sales
- This Year’s Sales
- Sales by Date Line Trend
- Year to Date Sales Bar Chart
By Item
- Customer by Item Category Sales
- Item Category by Customer by Date
By Order and Dimension
- User Defined Dimension by Dimension Sales Grid
- Sales by Global Dimension #1
- Sales by Global Dimension #2
- Sales by Dimension by Date
By Salesperson
- Sales by Salesperson
- Sales by Salesperson by Date
- Top Salesperson Sales
By Customer
- Sales by Customer
- Sales by Customer/Invoice
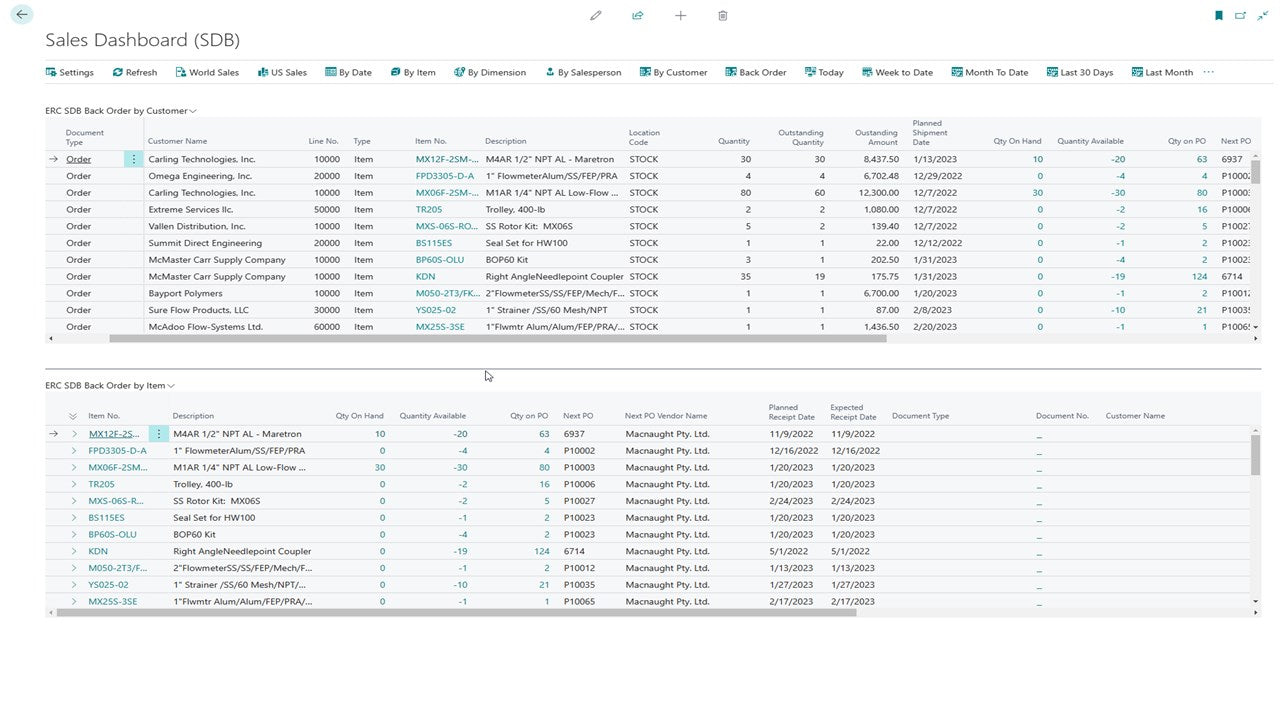
Back Orders
- Back Order by Customer
- Back Order by Item
Business Applications with staying power.
Our team would love to show you how RUX can benefit your business.

