

The RUX Rentals Dashboard brings complete visibility into your rental operation directly inside Microsoft Dynamics 365 Business Central. Whether you're a General Manager, Fleet Director, or Operations Lead, this dashboard surfaces the metrics your team needs to make faster decisions across eight purpose-built views, from Fleet Overview and Contracts Summary to Customer reliability scoring and Salesperson performance. You get a live picture of your entire rental business without leaving Business Central.
All metrics, charts, and drill-downs are embedded natively in Business Central. No external connections or data calls ensure accuracy, security, and speed. Data access is governed by your existing permissions, so every user sees exactly what they're authorized to see, right down to the underlying contract and invoice records. Any user with a Business Central license can be up and running quickly, with no third-party tools or integrations required.
The eight views of RUX Rentals Dashboard
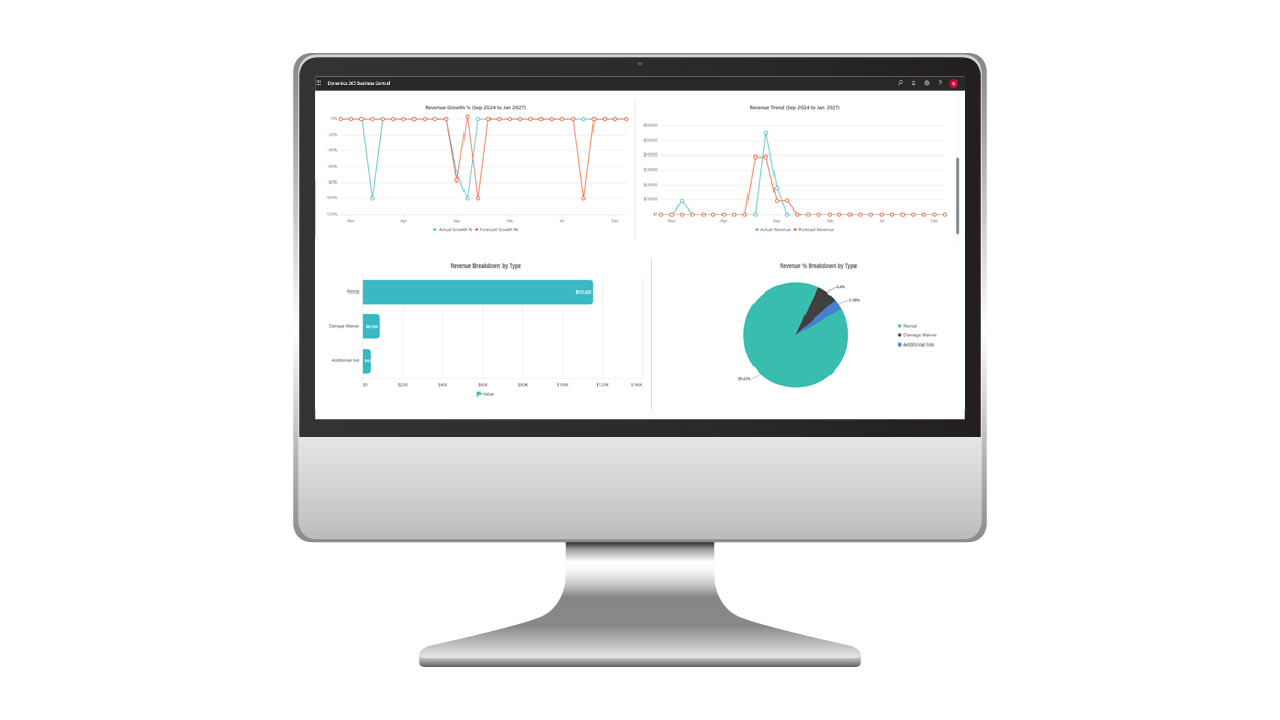
Fleet Overview: Per-unit revenue across six streams: Rental, Metered Usage, Periodic Usage, Standby, Damage Waiver, and Additional Fees. Includes Time Utilization %, ROI tracking, and a forecast overlay separating Committed from Expected Revenue based on historical trends.
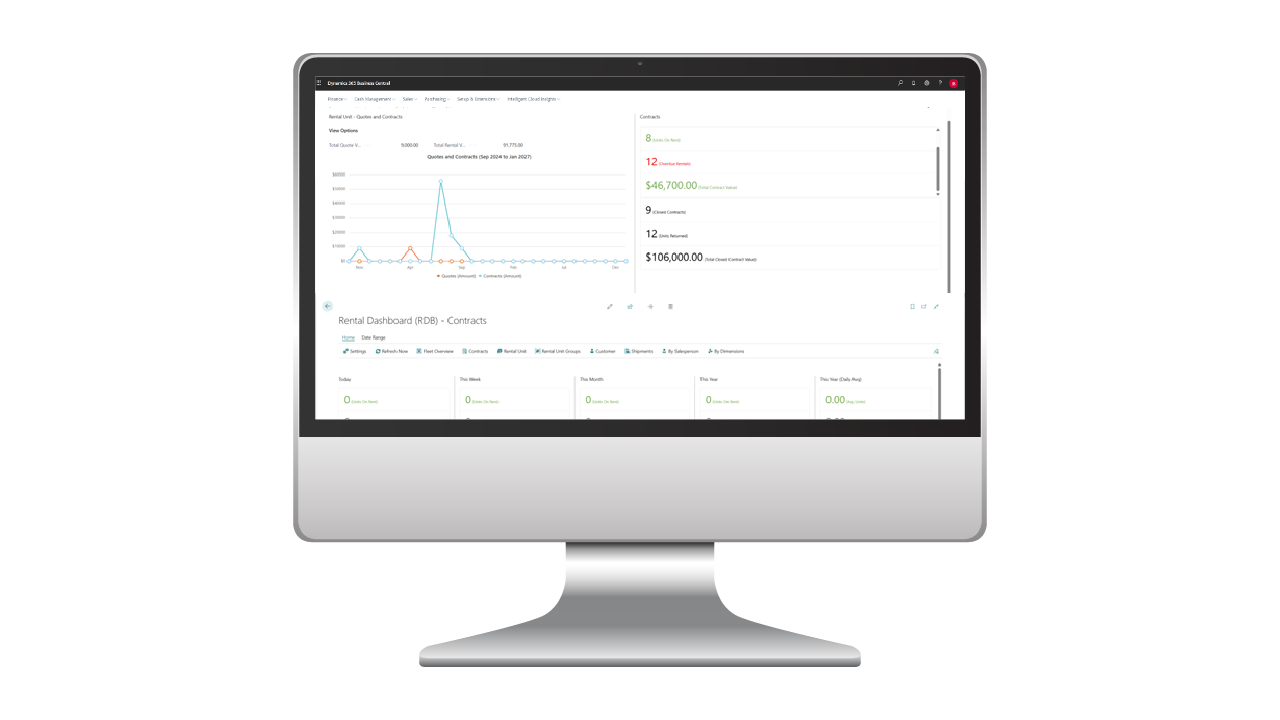
Contracts Summary: KPI cards for Today, This Week, This Month, and This Year, each showing Units On Rent, Units Returned, and Total Contract Value, with a daily average benchmarking card, quotes vs. contracts trend chart, and overdue rentals count.
Rental Units: A sortable list of every rental unit by Revenue, Utilization, Average Daily Rate, Days on Rent, or Availability, with pipeline visibility showing Qty. on Quote and Qty. on Contract alongside historical performance.
Rental Unit Groups: An expandable tree view rolling up unit-level metrics to parent rental groups for side-by-side category comparison, with auto-aggregated totals and full per-unit detail on expand.
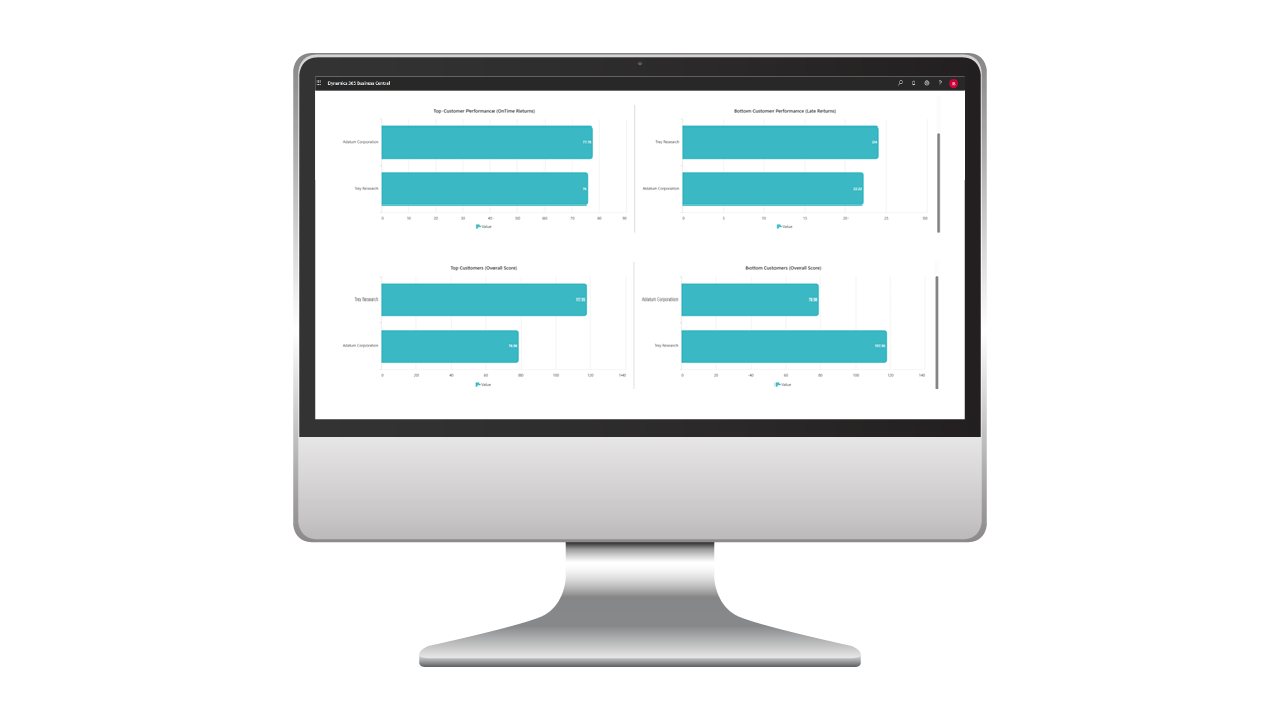
Customers: Reliability scoring based on On-Time Return %, Late Return Count, and Total Rentals, with contract duration breakdowns and best/worst on-time return comparison charts per customer.
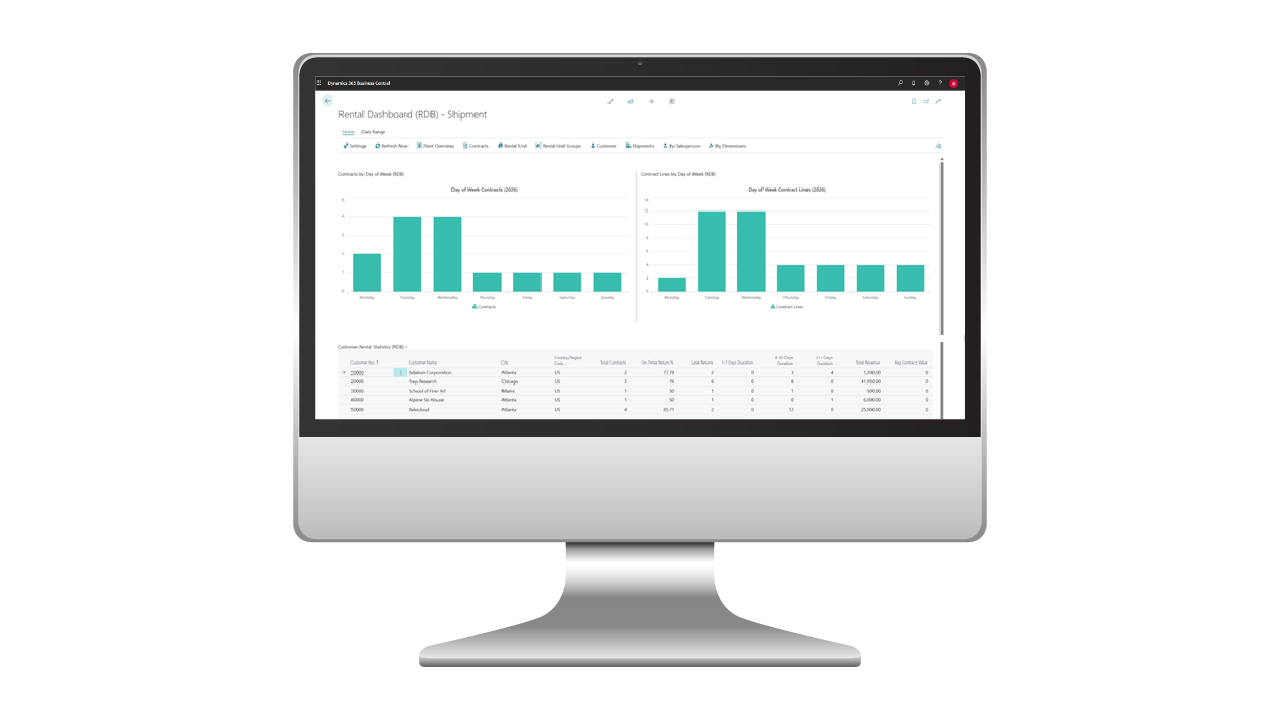
Shipments: Column charts showing contract and line volume by day of week, paired with a customer statistics grid covering revenue, return performance, and geographic data.
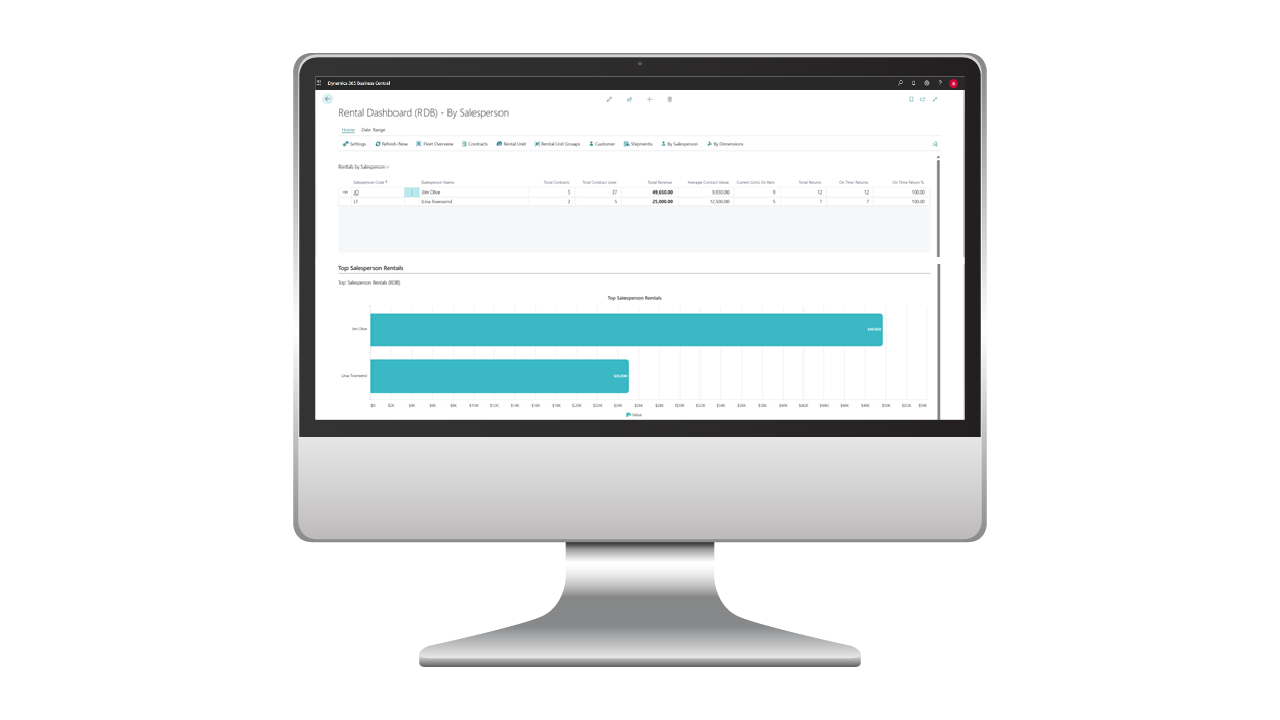
By Salesperson: A performance grid ranking reps by contracts, revenue, average deal size, and on-time return rate, with a top-10 revenue bar chart and the ability to filter by any date range.
By Dimensions: Two trend charts and a cross-tab matrix slicing rental revenue by any two Business Central dimensions, with every data point drilling down to the underlying posted invoice lines.
Every number, chart, and KPI in the dashboard is clickable, drilling directly into the contracts, lines, or invoice records behind the figure. Filterable by date range and customer across all eight views, the RUX Rentals Dashboard replaces disconnected reports and spreadsheets with a single live source of truth, giving your entire team the data they need to make smarter decisions right inside the system they already use every day.
Book a demo today!
Business Applications with staying power.
Our team would love to show you how RUX can benefit your business.

